van Holde - Weischet Tutorial |
sk = s0 (1 - sigmak Ck)
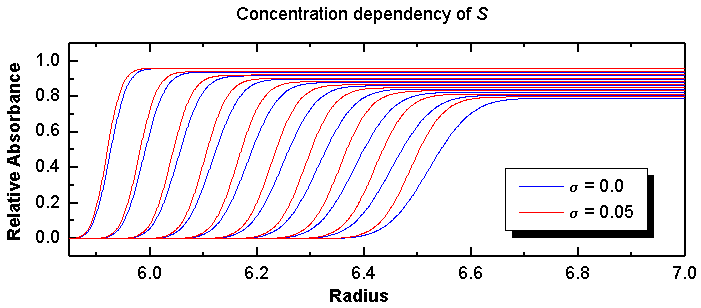
Figure 12: Single-component system simulated with the finite element
method.
Parameters: sedimentation coefficient:
8.0 x 10⁻¹³ seconds, diffusion coefficient:
2.0 x 10⁻⁷ cm2/sec, relative loading concentration:
1.0, Speed: 45,000 rpm, scan spacing: 10 minutes, with 20 minute initial
delay.
It is clear to see that the higher the concentration, the slower the molecules will move. This effect will become more obvious at later scans, causing a larger difference between sample with and without concentration dependency. Thus, for a single component, non-ideal system, the boundary fractions corresponding to the higher concentration will extrapolate to a slower S value than those corresponding to lower concentration, giving rise to the characteristic cross-over effect:
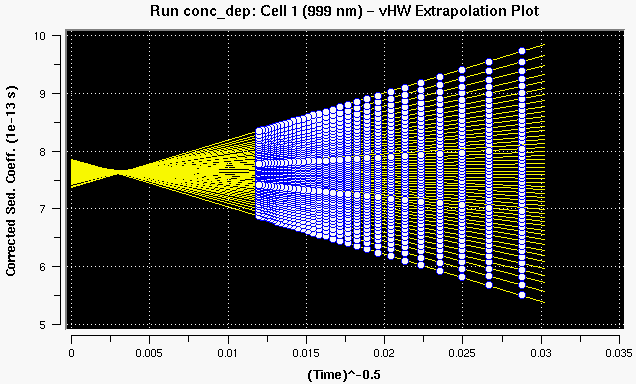
Figure 13: van Holde - Weischet extrapolation plot of the data above (with 30 scans) with concentration dependency. Note the crossing-over point indicative of concentration dependency of S.
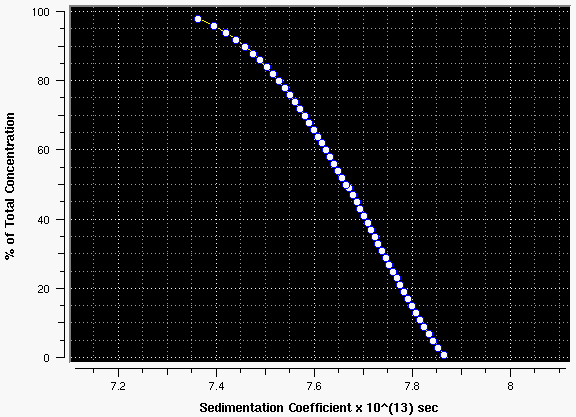
Figure 14: G(s) distribution plot of the data above. Note the negative slope indicative of concentration dependency of S.
For strongly concentration dependent samples, another diagnostic results from the fact that radial dilution changes the concentration dependency effect of S throughout the run, which is most notable in the upper boundary divisions:
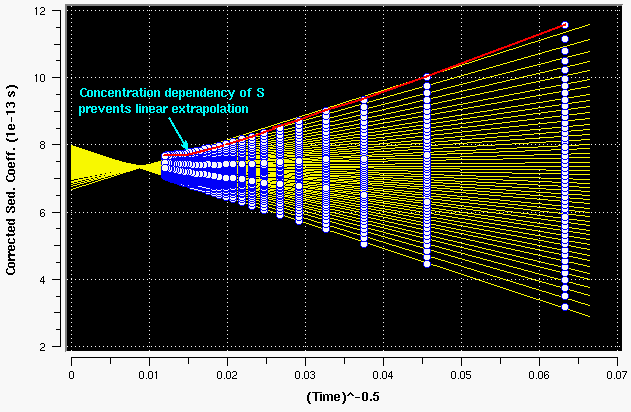
Figure 15: strongly concentration dependent sample. Note the arc that best fits the top boundary divisions. This is caused by radial dilution.
Possible Mis-Interpretations:
There is one instance where concentration dependent data could be
misinterpreted: If both heterogeneity and concentration dependency
of S are present, the positive slope in the distribution plot caused
by heterogeneity could be cancelled by the negative slope effect from the
concentration dependency. In such a case running multiple concentrations
of the same sample is necessary (which is always a good practice - regardless)
since it will unambigously indicate that the distributions change, if
concentration dependency is present. This is demonstrated in the plot
below:
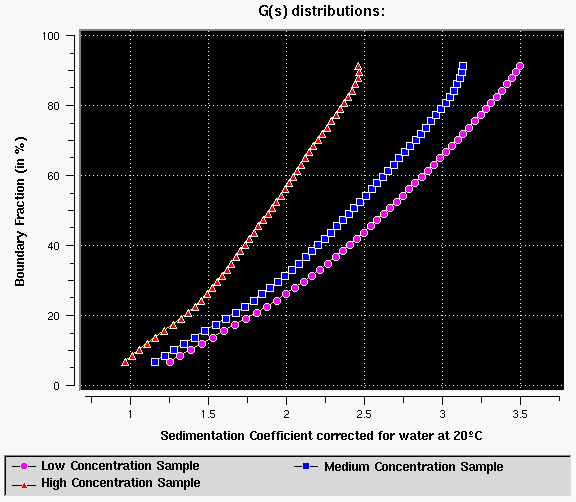
Figure 16: 6-component system with concentration dependency at three different concentrations - Note that the distributions change when the concentration is changed, indicating concentration dependency of S for a heterogeneous system. The two effects cancel each other and therefore a global measurement over several concentrations is always recommended to identify this condition. As a side note, it should be remarked that a self-associating system cannot be confused with this type of concentration dependency, since increasing the concentration will (by mass action) generally increase the sedimentation coefficient since the average molecular weight increases due to polymerization at higher concentration. This is true for reversible and irreversible associations. In some rare cases the self-associating system may produce very concentration dependent polymers (maybe due to end-to-end association which can cause considerable concentration dependency of S due to the asymmetric shape of the resulting molecule). In such cases the concentration dependency/self-association behaviour may be difficult to separate.
Another misinterpretation of extrapolation plots that show crossing-over can result when the crossing-over is not caused by concentration dependency of S, but rather by the loss of material, such as may be present in aggregating samples (please see the next section for additional details).
 |
 |
 |
This document is part of the UltraScan Software Documentation distribution.
Copyright 1998, 1999, The University of Texas Health Science Center at San Antonio.
The latest version of this document can always be found at:
Last modified on June 12, 1999.