van Holde - Weischet Tutorial |
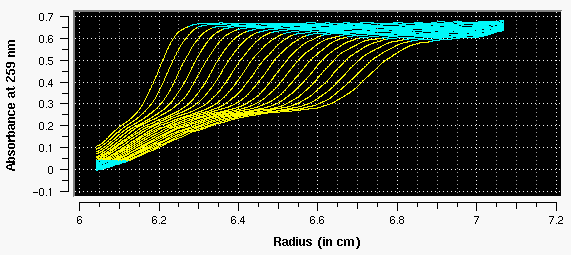
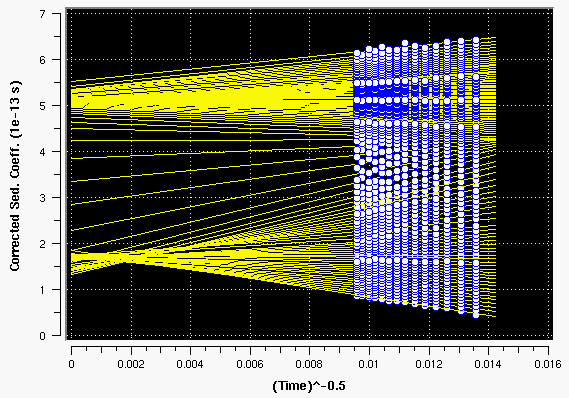
Shown below is the van Holde - Weischet analysis of experimental velocity data collected for a 2-component, ideal and non-interacting system consisting of chicken lysozyme and a 208 bp dsDNA fragment.

Figure 7: Experimental data. For this analysis, a portion of the data (3% at the top of the boundary near the plateau and 7% at the bottom of the boundary near the baseline) have been excluded. In addition, the first 6 scans have been excluded from the analysis, since their absorbance near the meniscus exceeds the baseline absorbance. Scans that do not contain a stable plateau or data that has not cleared the meniscus due to slow sedimentation should not be included in the analysis. The excluded boundary range is shown in light blue, while the analyzed data is shown in yellow.

Figure 8: Extrapolation plot of the experimental data shown in Figure 7.

Figure 9: Distribution plot of the experimental data shown in Figure 7.
 |
 |
 |
This document is part of the UltraScan Software Documentation distribution.
Copyright 1998, 1999, The University of Texas Health Science Center at San Antonio.
The latest version of this document can always be found at:
Last modified on June 12, 1999.