
|
|
Manual |
| Part 3: Scan Diagnostics | Previous: Model Selection |
Next: Next: Scan Editing
|
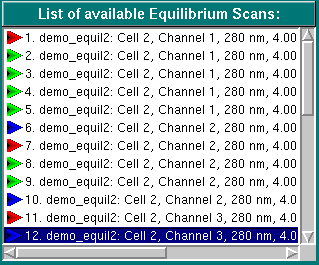
After selecting a model, the "Scan Diagnostics" button will be activated. This function will apply a series of tests prior to fitting to determine which of the available scans are suitable for inclusion in the fit. You have to execute this function before proceeding to the next functio. The following tests will be employed:
If three or more warnings were generated, the scan will be
marked with a blue triangle ( ) in the
Scan Listbox and automatically
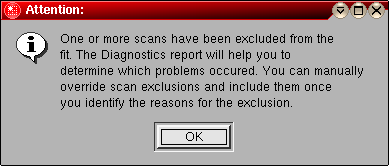
excluded from the fit. After reviewing the reason for the exclusion
and assigning initial parameter estimates, you can override the
exclusion by double-clicking on the scan in the scan listbox. In
that case, the scan will be labeled with a red triangle (
) in the
Scan Listbox and automatically
excluded from the fit. After reviewing the reason for the exclusion
and assigning initial parameter estimates, you can override the
exclusion by double-clicking on the scan in the scan listbox. In
that case, the scan will be labeled with a red triangle ( ) to indicate manual selection of this scan. Scans
that were found acceptable for inclusion into the fit will be marked
with a green triangle (
) to indicate manual selection of this scan. Scans
that were found acceptable for inclusion into the fit will be marked
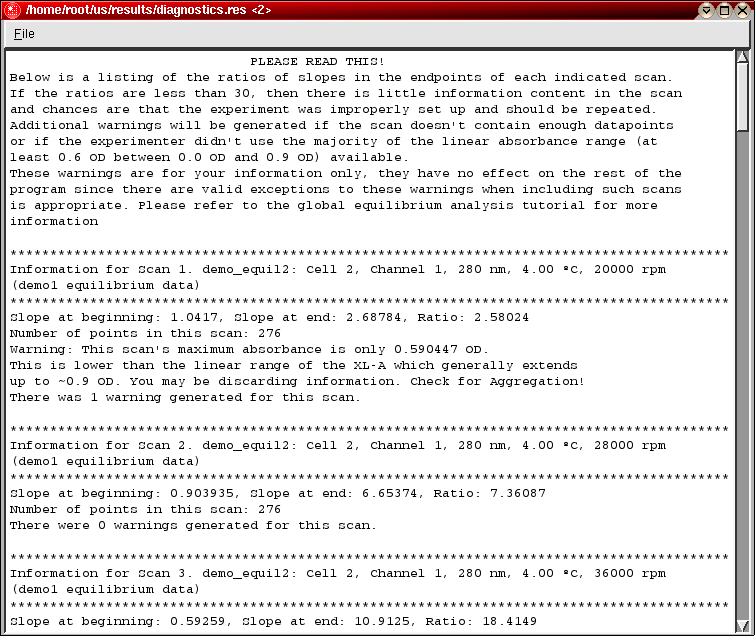
with a green triangle ( ). These warnings
are for your information only, they have no effect on the rest of
the program since there are valid exceptions to these warnings when
including such scans in a fit is appropriate. Please refer to the
global equilibrium analysis
tutorial for more information.
). These warnings
are for your information only, they have no effect on the rest of
the program since there are valid exceptions to these warnings when
including such scans in a fit is appropriate. Please refer to the
global equilibrium analysis
tutorial for more information.
After the scan check a listing identifying any problems found will be generated and displayed in an information window. If any warnings were generated, a note will be printed on the screen. All collected information will also be written to a file in the UltraScan root directory, called "diagnostics.res". This file can also be printed from the file menu of the information window.
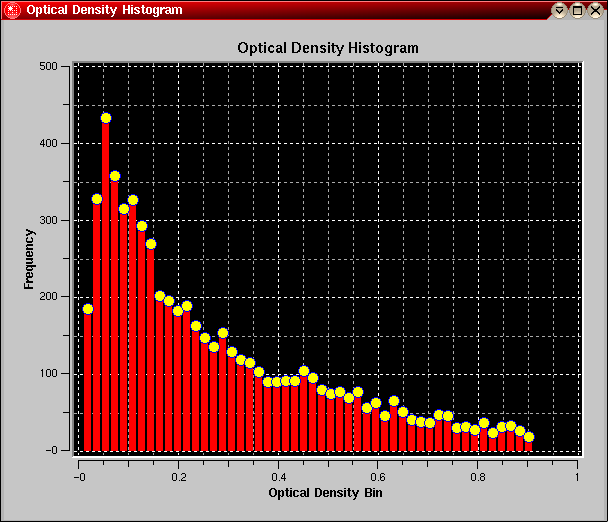
After the scan diagnostics have completed, and all scans have been assigned as either included (green arrow) or excluded (blue arrow), the Concentration Histogram button will be activated. Clicking on this button will generate a concentration histogram of all included scans. The program will sample each datapoint of each included scan and count the frequency of occurence for each concentration. The program will subdivide the concentration range defined by the lowest and highest concentration occuring in any included scan into fifty equally spaced bins and plot the frequencies of each bin.
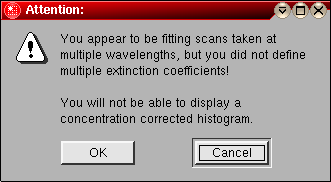
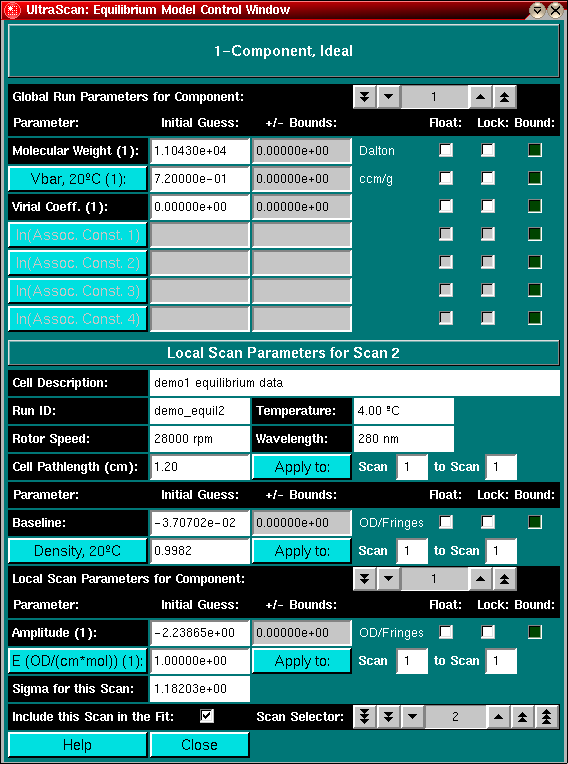
The purpose for this plot is to provide a qualitative idea of the signal strength for each concentration present in the fit. Since self-associating models depend on a concentration range which leads to the presence of multiple species, the signal provided by each species is hence directly correlated to the concentration. If you have a self-associating system present, the signal strength ideally should be equally represented for each concentration/species. If the data includes data taken at multiple wavelengts, a warning will be printed to alert you that you should correct the extinction coefficients for each wavelength so that all concentrations can be displayed, and corrected for differences in absorptivity. In that case, only a histogram of the optical densities is possible. This can be handled in the model control module which is described in more detail here.
| Previous: Model Selection | Scan Diagnostics |
Next: Next: Scan Editing
|
This document is part of the UltraScan Software Documentation
distribution.
Copyright © notice.
The latest version of this document can always be found at:
Last modified on January 12, 2003.